After two years of steady progress, the Fed’s attempt to cool Covid-era inflation without triggering cracks in the job market now seems to be running out of momentum. The envisioned and much-anticipated “Soft Landing” has now put monetary policy in a difficult position. As of October 3, 2025, the Federal Reserve has let the inflation rate be above target for over 4 ½ years. Core PCE, the Federal Reserve’s preferred inflation measure, has shown significant persistence and concerns that inflation may become entrenched closer to the 3% level have risen. Meanwhile, the labor market has shown weakness with low hiring rates and a rise in monthly layoffs. Significant downward jobs revisions show that the US economy added a million less jobs than originally estimated. With upward pressures on inflation remaining steadfast and mounting downward pressures on unemployment, the Fed’s Dual Mandate objectives are in conflict. Much attention and coverage has been given the labor market, however, I’ll explore recent developments in inflation dynamics and risks to policy.
First, to analyze spending within the US economy, I use real final sales to private domestic purchasers to measure inflation adjusted spending by US households and businesses. Figure 1 depicts real final sales to private domestic purchasers from Q2 2015 to Q2 2025, chained in billions of 2017 US dollars and seasonally adjusted.
Figure 1:
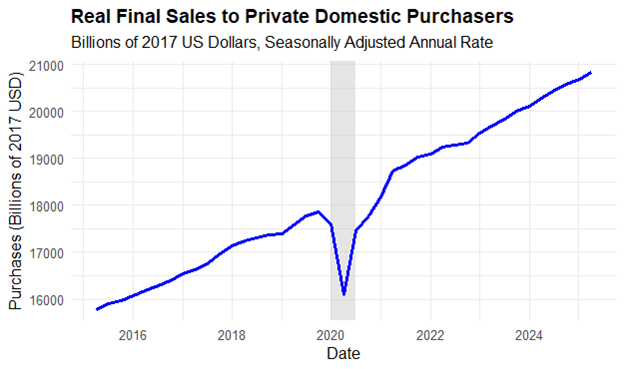
Real final sales to private domestic purchases serves as a more robust indicator of economic growth than GDP as it focuses on domestic private demand. The measure combines Consumption (C) and Gross Private Fixed Investment (I) from the GDP function and excludes government spending, inventory changes, and net exports to measure private domestic demand. Figure 1 shows consistent growth up until the COVID-19 pandemic and recessions in the first half of 2020, before bouncing back to its long-term growth trend. The sustained post-2020 growth implies that private domestic purchasers have regained confidence, potentially supported by fiscal stimulus, accommodative monetary policy, and labor market recovery. Despite shakiness in consumer sentiment and signs of labor market weakness, private demand continues to grow at its historical rate.
Figure 2 explores three variations of the Fed’s preferred inflation gauge, Personal Consumption Expenditure (PCE). The green line tracks Median PCE Inflation, the blue line follows Core PCE, and the orange line displayed Market Based PCE Inflation less food and energy. All 3 inflation rates are annualized year over year inflation readings.
Figure 2:
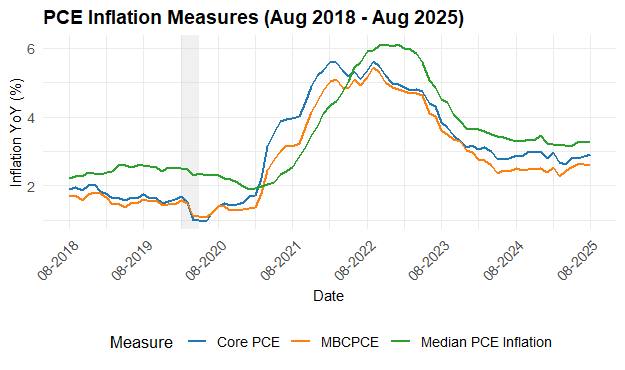
Median PCE inflation, currently at 3.3%, has remained persistently elevated relative to Core PCE (2.9%) and Market-Based Core PCE (2.6%), signaling a potential stalling in disinflationary momentum. This divergence reflects deeper statistical properties embedded in each measure. Median inflation, by definition, captures the 50th percentile of the cross-sectional distribution of price changes, making it inherently less sensitive to outliers and extreme values. As such, it offers a more robust indicator of the central tendency in inflation dynamics, particularly when the distribution of price changes is skewed or exhibits high kurtosis. Core PCE, a weighted mean that excludes food and energy, remains vulnerable to distortions from the tails of the distribution—especially in periods of positive skewness, where a small subset of items experience outsized price increases. This skewness inflates the mean relative to the median and introduces greater temporal volatility. The persistent gap between Core PCE and Median PCE inflation thus reflects the asymmetric nature of price changes and underscores the reduced weight of tails in the median measure. Consequently, median inflation exhibits greater persistence and lower short-term variability, making it a more reliable gauge of underlying inflation pressures in the economy.
Market Based Core PCE (MBCPCE) constitutes close to 86% of the current PCE index, while non-market based PCE less food and energy, whose components include financial services furnished without payment, medical care and hospitalization services, social assistance services, and final consumption expenditures of nonprofit institutions.1 Market Based inflation is more representative of inflation that is the most responsiveness to monetary policy actions and the unemployment gap. Market Based PCE is more indicative of supply and demand movements within the economy, giving the Fed a clearer picture of movements in aggregate demand within the economy.
Meanwhile, PCE less food and energy, or Core PCE, used to measure demand-driven inflation, has barely budged since August 2023 and has remained entrenched near the 3% mark. The lack of disinflation momentum is posing a challenge for the Federal Reserve, particularly to its credibility to reel inflation back to its 2% target and ensure that inflation does not become entrenched at 3%. To understand more about the drives of Core PCE inflation, I decompose
Core PCE inflation into its three main components, displayed in Figure 3.
Figure 3:
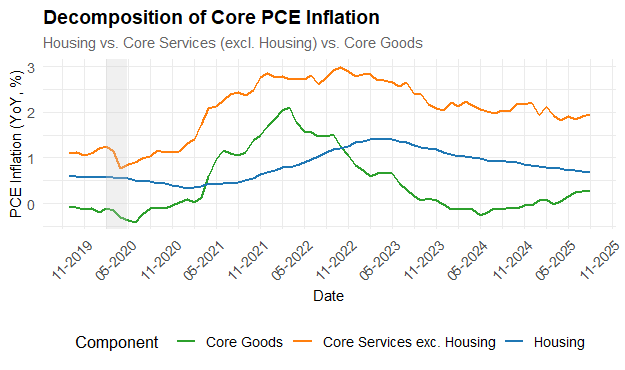
Core Services inflation rose sharply following the end of lockdown protocols in a bout known as “Revenge Spending” from US consumers. Starting at the end of 2022, Service inflation has cooled but has remained elevated at the 2% mark. Mark Zandi, Chief Economist at Moody’s Analytics, remarked “those in the top 20% of the income distribution are driving the economic train3.” The emergence of a “K-Shaped” economy is worrisome. The uneven spending habits of the top 20% of the income distribution vs. the rest of the consumer base varies in response to monetary policy and wage growth, as the fuel of the spending machine of top 20% of income is powered by the historically strong stock market performance. Secondly, housing inflation has shown signs of cooling and disinflation back to its pre-pandemic rate. However, housing in CPI and PCE are weighted differently, with housing coming up with 15-17% of the total PCE index while CPI has housing weighted closer to 33% of the total index. The housing component is known for its high persistence due to rigid contracts and contributions to sticky inflation.
From late 2019 through mid-2021, core goods inflation rose sharply due to supply chain disruptions, inventory shortages, and elevated demand. The short-lived rise quickly moderated. Surprisingly, after Trump’s liberation day announcement, core goods inflation has been slow to rise. Figure 4 illustrates the Produce Price Index, which captures inflation from the seller’s side and is often seen as indicative of future price movements.
Figure 4:
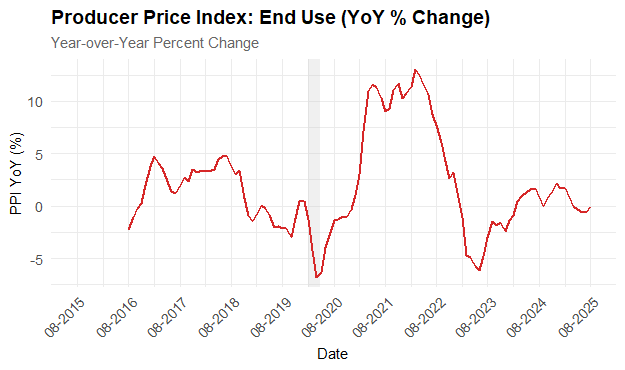
PPI rose significantly following the pandemic-era recession due to supply disruptions, low inventories, and rising demand. Inflation in core goods quickly followed in 2021. When President Trump announced his sweeping Liberation Day Tariffs, many expected similar inflation to be translated into Core Goods inflation and drive up PCE Inflation drastically. However, the PPI has not displayed the much-expected increase, and core goods inflation has risen modestly. The July 30 FOMC minutes show the divergence of views the FOMC committee members have about the not materialized tariff effects on price dynamics and what the future path inflation will be. The July 30 FOMC committee diverged in views particularly about the transmission of costs, constraints of the price-pass through, and inflation persistence.
- On the transmission of tariff costs:
- Some participants noted that foreign exporters were absorbing only a modest portion of the tariff burden, meaning U.S. businesses and consumers were bearing most of the cost.
- Several participants anticipated that firms would increasingly pass these costs on to end-customers over time, especially as pressures accumulate.
- Others highlighted that many businesses were actively trying to avoid full pass-through by adopting alternative strategies—such as renegotiating supplier contracts, altering production methods, cutting margins, restraining wage growth, or investing in automation and efficiency improvements.
- On constraints to price pass-through:
- A few participants emphasized that weak demand conditions were limiting firms’ ability to raise prices, suggesting that the inflationary impact of tariffs might be muted in the short term.
- On inflation persistence:
- Some participants believed that tariff-induced price increases would result in a one-time upward shift in the price level, with limited long-term inflationary consequences.
- Others warned that tariff-related disruptions, especially to supply chains, could contribute to more persistent inflation, and that it may be difficult to distinguish these effects from shifts in underlying trend inflation.
While some members viewed the tariff effects as a one-time price increase and recommended the Fed to “see through” these tariff effects, several committee members warned the potential threat of inflation persistence due to tariffs. Figure 5 demonstrates the near-term inflation outlook. The blue line is the University of Michigan Survey of inflation expectations, while the orange line is the calculated 2-year inflation expectations compiled by the Federal Reserve Bank of Cleveland.
Figure 5:
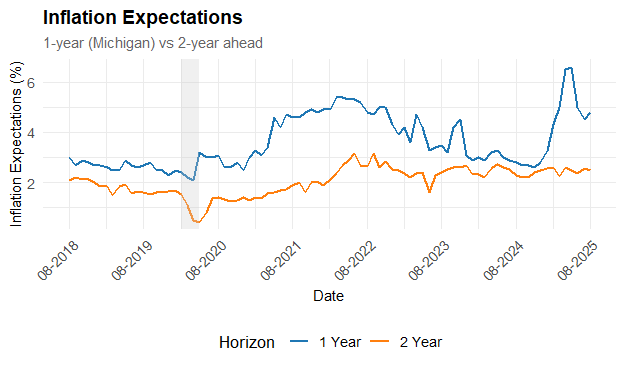
1 year inflation expectations remained volatile and above the 2% target, while 2-year inflation expectations remained anchored closer to the 2% target following the 2020-2022 inflation surge. The discrepancy shows that inflation expectations reflected transitory inflation expectations, with inflation surging before moderation in the 2-year horizon. After the announcement of the Liberation Day tariff policies, 1 year consumer inflation expectations jumped to nearly 6%. However, 2-year inflation expectations remained low and stable, close to the 2% mark. Gorodnichenko and Coibion (2025) remark that shocks to short-run inflation expectations are typically long lived and can exert a pronounced effect on long-run expectations. When it comes to actual price-setting behavior, expectations established over the short-term horizon matter more than long term inflation expectations. Firms adjust prices on the near term inflation outlook until their next price adjustment and given that U.S. firms tend to revise prices at least annually (Bils and Klenow, 2004; Nakamura and Steinsson, 2008), it is the near-term inflation trajectory which shapes their immediate responses to cost pressures and demand conditions.
Conclusion
The Federal Reserve finds itself in a difficult position. The much-awaited “Soft Landing” seems to be slipping out of reach as both of its Dual Mandate goals are in tension. Considerate upside risks to inflation remain persistent while considerate downside risks to employment are starting to emerge. In order to improve the outlook to either side of its mandate, the Fed must sacrifice progress made to one of its Congressionally mandated policy objectives.
References
Verbrugge, Randal J., and Saeed Zaman. 2025. “Understanding Inflation via Developments in Market and Nonmarket Inflation Rates.” Federal Reserve Bank of Cleveland, Economic Commentary 2025-09. https://doi.org/10.26509/frbc-ec-202509
Smith, Simon C., and Alexander L. Wolman (2024). “New tools to monitor inflation in real time,” FEDS Notes. Washington: Board of Governors of the Federal Reserve System, December 20, 2024, https://doi.org/10.17016/2380-7172.3617.
Wallace, A. (2025, September 18). US economy’s K-shaped recovery reshapes consumer spending. CNN. https://www.cnn.com/2025/09/18/business/us-k-shaped-economy-spending
FOMC July 30 Minutes; The Fed – Monetary Policy:
Coibion, O., & Gorodnichenko, Y. (2025). Inflation, Expectations and Monetary Policy: What Have We Learned and to What End? (No. w33858). National Bureau of Economic Research.
Bils, M., & Klenow, P. J. (2004). Some evidence on the importance of sticky prices. Journal of political economy, 112(5), 947-985.
Nakamura, E., & Steinsson, J. (2008). Five facts about prices: A reevaluation of menu cost models. The Quarterly Journal of Economics, 123(4), 1415-1464.
Data for Figures
Figure 1: FRED
Figure 2: Median PCE Inflation & FRED for Market Based Inflation Less Food and Energy
Figure 3: PCE Inflation Contributions from Goods and Services – San Francisco Fed
Figure 4: FRED
Figure 5: FRED


Leave a comment