Britian’s housing debate if often framed through national averages. National house price growth, intended housing construction targets announced by Westminster, or the Bank of England rate decisions are often the numbers that are captured in the headlines. Yet, these figures only tell part of the story behind the broader cost-of-living crisis engulfing Britian. Beyond national aggregates lie regional markets that are not only influenced by national macroeconomic movements, but also by their own local dynamics. The Midlands housing market demonstrates that one national aggregate is often not enough to capture the regional structural forces shaping housing outcomes across the region and demonstrates that some areas have weathered housing pressures more successfully than national figures would suggest.
Housing affordability, often measured as a ratio of median house prices to median earnings, rose sharply during the Covid-19 pandemic as a result of national lockdowns, work from home (WFH) schemes, higher inflation, and elevated mortgage rates. The surge in housing unaffordability during the pandemic was significant, but the broader cost-of-living crisis has been growing since the late 1990s. Figure 1 (see below) compares the affordability ratio for the broader England & Wales housing market to the rise in unaffordability in the regional East and West Midlands from 1997-2025.
Housing Affordability Has Spiraled Since 1997
Figure 1: House Price-to-Earnings Ratio (1997-2025)
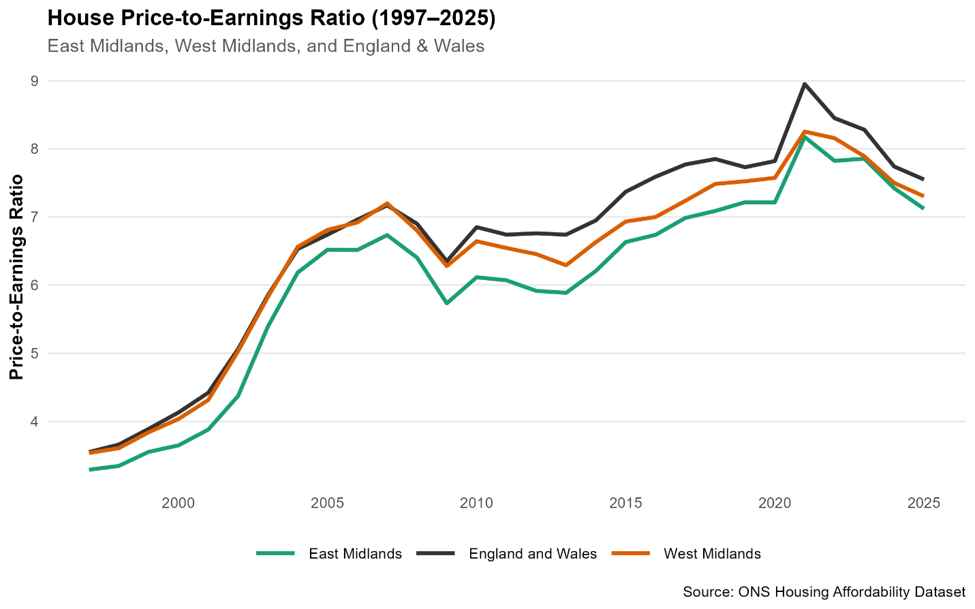
The year 1997 was described as the last year of “pre-housing crisis Britian” by Dr. Kristian Niemitz[NS1] , IEA Editorial Director and Head of Political Economy. The West and East Midlands have maintained better affordability (lower house price to earnings ratio) compared to England & Wales, but the region has followed the national boom bust cycle. As a result, the overall house price to earnings ratio has risen above the recognized affordability benchmark of 5x, or the median house price being 5 times the median local earnings.
The Midlands’ housing market, along with the rest of national housing market, reached an inflection point in 1997 due to a culmination of various structural factors and shortcomings on political promises. The rise was in part due to construction rates in the 1950s-1970s dropping below demand. Stronger demographic growth in the 1990s pushed up house prices due to limited supply, and the construction of new homes to correct for the decades of low construction was unable to mitigate the effects of stronger demographic pressures and demand. Furthermore, the emergent financial phenomenon of ‘negative equity’ , or when the property value falls below of the initial mortgage paid to purchase the property, froze the housing market as households were unable to sell their homes without taking a significant pitfall of cash and less households relocated for work.
The Great Financial Crisis of 2008 saw a fall in the affordability ratio, but not due to greater earnings or the mass construction of new homes. The GFC brought about a collapse in credit availability and households were faced with growing mortgages and the risk of repossession, leading to reduced demand and a fall in house prices. The cost-of-living crisis has continued on its upward trajectory, and the Midlands have not been immune to the greater national trends. Even though the aggregate affordability ratio has returned to its pre-pandemic level, housing pressures across local authorities in the Midlands have stabilized at various levels. Figure 2 (see below) plots the percent deviation of the affordability ratio from the national average for each Midlands’ local authority.
The Midlands Reveal a Divergent Housing Market
Figure 2: Midlands Housing Affordability (2025)

The Midlands reveal a diverse housing market across local authorities, but many local authorities have settled at a ratio below the average level of affordability in England & Wales, thus increasing the prospect of homeownership for local residents. More districts in the West Midlands have above-average affordability ratio compared to the East Midlands, including both urban and rural districts. The cost of living in West Midlands remains slightly higher than in the East Midlands due to a greater network of commuter districts, urbanization, and industry concentration. Nevertheless, the regional cost-of-living divide between the West and East Midlands is not as obvious and is prone to fluctuations within individual local authorities. For instance, Stratford-upon-Avon had a median house price to income ratio of 11.36 in 2022, well above the UK average and remained one of the most unaffordable local authorities in the West Midlands. However, house prices in Stratford-upon-Avon have greatly declined since then, and as of 2025, the affordability ratio stands at 7.48, just slightly below the national aggregate.
Income, though important in determining housing prices, isn’t the only factor influencing house affordability. Figure 3 (see below) shows the Midlands housing market after accounting for income. I regress median house prices on median incomes, capture the residuals, and plot the residuals by local authorities. Thus, positive residuals indicate local authorities have higher house prices than predicted by local income, or in other words, have an overvalued housing market. Meanwhile, local authorities with negative residuals have lower house prices than predicted by income, or have an undervalued housing market.
Figure 3: Midlands Housing Pressures After Accounting for Income (2025)

Figure 3 shows that the West Midlands have more local authorities with overvalued housing markets than the neighboring East Midlands. However, most of the overvalued local authorities, such as Warwick, Lichfield, and Bromsgrove, are rural areas rather than dense urban areas of Black County, Coventry, or Birmingham. Local house prices are not only shaped by local income, but are also shaped by local development costs such as land prices, labour costs, regulatory barriers, and geographic constraints. Since the West Midlands have more overvalued housing markets, households experience greater financial entry barriers despite having similar incomes as those in the East Midlands, and higher barriers disproportionately affect the younger population and contribute to the generational divide of homeownership. Meanwhile, the East Midlands have more local authorities with undervalued housing markets, hinting at greater housing affordability and smaller financial barriers for those eager to become homeowners.
Conclusion
The cost-of-living crisis and the pathway to affordable housing has shaped public discourse for decades. National aggregates have shown tremendous rise in the house price-to-income ratios, yet regional forces have shaped the housing market all across the country. The Midlands, situated in the heart of England, demonstrate the regional variety of housing. A one size fits all policy seldom works, and the Midlands show the importance of targeted housing policy to help mitigate the cost-of-living crisis.
References
Gentle, C., Dorling, D., & Comford, J. (1994). Negative equity and British housing in the 1990s: cause and effect. Urban Studies, 31(2), 181-199.
Niemetz, K. (2024, January 15). 1997: The last year of pre-housing-crisis britian. Institute of Economics Affairs. https://iea.org.uk/1997-the-last-year-of-pre-housing-crisis-britain/

 Econothoughts
Leave a comment